IELTS Writing: Task 1 analysis with model answer

Both writing tasks in the IELTS exam are marked out of 9 and are assessed according to four categories: Task Achievement, Coherence and Cohesion, Lexical Resource, and Grammatical Range and Accuracy.
Below is given a student’s response to Task 1 followed by comments to correct and improve each paragraph.
There is also another answer you can use as a good model for the same graph.
Task 1 Question
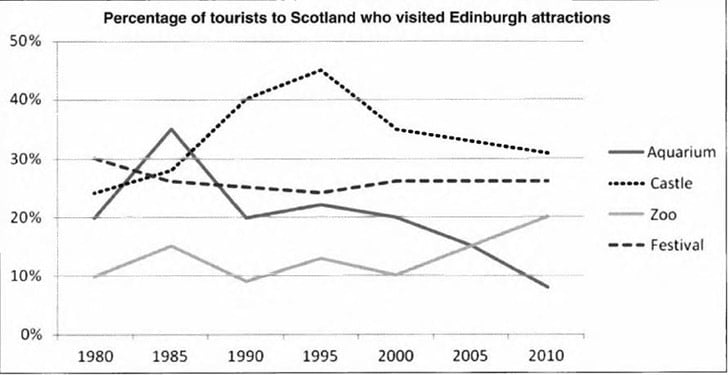
The line graph below shows the percentage of tourists to Scotland who visited four different attractions in Edinburgh. Summarize the information by selecting and reporting the main features, and make comparisons where relevant.
Write at least 150 words
Student’s response
The line illustrates the proportion of tourists visiting various attractions in the capital of Scotland Edinburgh between 1980 and 2010.
It is clear that the most popular attraction among tourists was zoo in 2010. The number fluctuated from 10% to 20% during 30 years. While the proportion of tourists visited festivals decreased slightly from 30% and went on down gradually. From 2000 to 2010 the number of visitors of festivals remained stable.
The least visited attractions were castle and aquarium in the last 10 years. The number of tourists who visited castles dropped significantly from the highest percentage over 40% in 1995 to 30% in 2010.We can see the same tendency with the number of tourists visited aquariums. There was a sharp increase in tourists from 20% to over 40% between 1980 and 1985. Then it dropped rapidly; however, there was a slight rise in 1990 for about five years. After that the percentage of tourists visited Edinburgh aquarium continued to decrease gradually and reached the minimum for under 10% in 2010.
Task 1 Analysis and comments
(1) Introduction
The line illustrates the proportion of tourists visiting various attractions in the capital of Scotland Edinburgh between 1980 and 2010.
The student paraphrased the statement in the writing task successfully by using synonyms:
- Shows > illustrates
- Percentage > proportion
- Who visited > visiting
- Different > various
Problem areas
- The word “graph” is missing, “line graph.”
- A comma is missing after “Scotland.”
(2) Paragraph 1
It is clear that the most popular attraction among tourists was zoo in 2010. The number fluctuated from 10% to 20% during 30 years. While the proportion of tourists visited festivals decreased slightly from 30% and went on down gradually. From 2000 to 2010 the number of visitors of festivals remained stable.
An attempt is made to diversify sentence structures and create coherence through introductory phrases and conjunctions.
Problem areas
- This paragraph is supposed to be an overview, but a general statement is made only in the first sentence. Also, the paragraph contains too much detail such as years and percentages relating to only two attractions while the other two are not mentioned at all.
- Attractions are usually capitalized and used with the article “the” – “the Zoo, the Festival.”
- Word order is wrong – “the most popular attraction among tourists in 2010 was the Zoo”.
- There wasn’t one particular number at all times; hence, the plural is needed – “the numbers.”
- Wrong usage of the conjunction “while.” It must connect two opposing points in one sentence.
- “visiting” instead of “visited” because the original verb is not passive but active.
- “went down” instead of “went on down.”
- A comma is missing after “From 2000 to 2010”.
- We say “visitors to a place,” not “of.”
(3) Paragraph 2
The least visited attractions were castle and aquarium in the last 10 years. The number of tourists who visited castles dropped significantly from the highest percentage over 40% in 1995 to 30% in 2010.We can see the same tendency with the number of tourists visited aquariums.
There was a sharp increase in tourists from 20% to over 40% between 1980 and 1985. Then it dropped rapidly; however, there was a slight rise in 1990 for about five years. After that the percentage of tourists visited Edinburgh aquarium continued to decrease gradually and reached the minimum for under 10% in 2010.
Varied vocabulary is used to describe changes. The information almost accurately reflects the developments in the graph.
Problem areas in Paragraph 2
- The first sentence of the paragraph contains inaccurate information stating that the Castle was the least visited attraction.
- Wrong word order and article use – “The least visited attractions in the last ten years were the Castle and Aquarium”.
- “From the peak of about 45%” instead of “the highest percentage over 40%.”
- “tendency in” instead of “tendency with”
- “visiting” instead of “visited.”
- A comma is missing after “After that.” It is an introductory phrase, hence should be followed by a comma.
- “fell to a low of” instead of “reached the minimum for”.
Rather than stating the detailed changes of graphs for individual attractions, more comparison and contrast should be provided throughout the whole report.
Considering the problem areas in this task 1, the band score for this answer is 5.
Read Also: Recent Academic IELTS Writing task 1 exercises – Bar Charts
Task 1 Model answer band 9
The line graph demonstrates the percentage of visitors to four sights in Scotland capital, Edinburgh between 1980 and 2010. The four attractions are Aquarium, Castle, Zoo, and Festival.
Overall, the Festival and the Aquarium had downward trends while the Castle and the Zoo saw more visitors at the end of the 30-year period than at the beginning. The slightest changes occurred in the Festival figures while the most significant fluctuations were seen in the numbers of people visiting the Aquarium.
The Aquarium and the Zoo saw similar developments until 2000, starting at 20% and 10% respectively and experiencing a series of rises and falls. From 2000 to 2010, the proportion of visitors to the Aquarium went down dramatically to about 8%, resulting in the lowest number among the four sights. Meanwhile, the Zoo figures rose sharply ending the interval at 10%.
Although having a downward trend, the Festival’s numbers decreased slightly by only about 5%, which made it the second most popular place among tourists in 2010. In contrast, Castle rose in popularity reaching a peak of almost 45% in 1995 and becoming number one attraction with just over 30% of visitors at the end of the period.